Assessments | SEI Core EQ Tool | Dashboard
Emotional
Intelligence
Dashboard
Measure EQ strengths, challenges and talents
for a group, team or class

Distilling the power of an advanced assessment tool into one page of quick, meaningful insight, the Dashboard provides a snapshot of a group’s overall emotional intelligence and its distribution of Brain Styles, Brain Talents, strengths and opportunities.
Dashboard
The Dashboard is a one-page SWOT analysis of a group or team.
Starting from neuroscience and 15 years of research on emotional intelligence, the Dashboard provides a simple, practical summary of a group’s style for using emotional intelligence, its top talents, and how that impacts the group or team’s performance.
How to use: The Dashboard is highly effective for team formation and development, strategic workforce planning and coaching.
What’s in it:
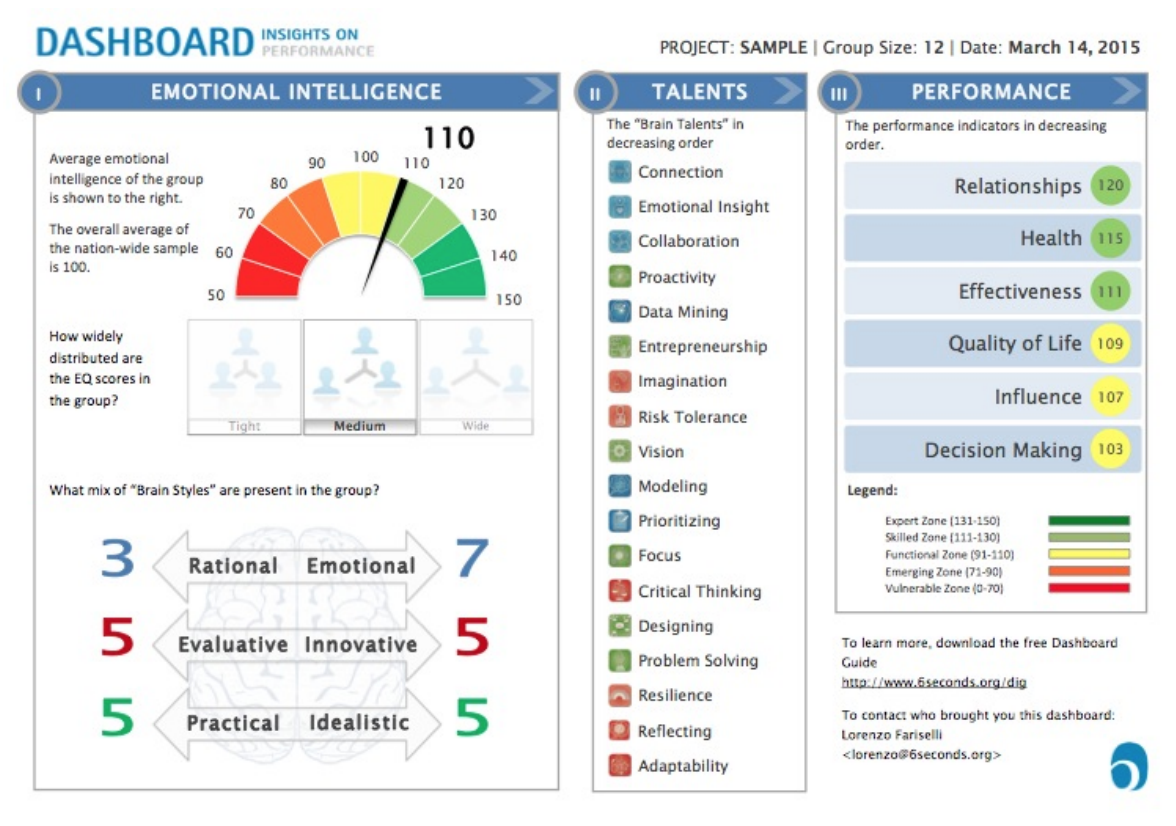
Emotional Intelligence
The speedometer shows the group’s average level of emotional. The score represents the capability to be aware of emotions, to manage reactions and to align choices toward the long-term. The value on the speedometer is an average score of the whole group, but it could be the individuals are far below and above that average. So under the speedometer is a graphic showing coherence.
Brain Styles
In line with the Brain Brief Profile, this graphic shows how many people are on each side of each scale. How many people prefer rational data vs emotional data? Cautious decisions vs seeking opportunity? Immediate action vs long term vision?
The Brain Apps
This list provides deeper knowledge of the capabilities of the work group. Which are the strongest Apps? Can you leverage these? Which are the weakest Apps? Can you protect from these gaps? Perhaps most importantly: Are there some Apps that you must develop because they’re essential to reach you objectives?
Outcomes
The right-hand chart on the Dashboard shows average scores on perceived performance outcomes: Effectiveness, Relationships, Health, Quality of Life, Influence, Decision Making. They’re showing in order, from highest to lowest, with a color-code to signify overall strength.
How to access: To use the Dashboard in your organization or with your team, students or clients, get equipped with your Brain Profiler Certification.
More: Download the Brain Profiles Technical Manual, an overview of the psychometric properties of the tool.

Request a sample report and additional information here